B) False
Correct Answer

verified
Correct Answer
verified
Multiple Choice
In order to study labor markets more easily, we make which of the following assumptions about firms? (i) Firms sell their products in competitive markets. (ii) Firms buy their inputs in competitive markets. (iii) Firms maximize profits. (iv) Firms maximize revenues.
A) (iii) only
B) (i) and (iii) only
C) (i) , (ii) , and (iii) only
D) (i) , (ii) , (iii) , and (iv)
F) C) and D)
Correct Answer

verified
Correct Answer
verified
Multiple Choice
The value of the marginal product of labor is calculated by multiplying the
A) price of output by the quantity of labor.
B) price of output by the marginal product of labor.
C) wage by the quantity of labor.
D) wage by the marginal product of labor.
F) A) and D)
Correct Answer

verified
Correct Answer
verified
Multiple Choice
If the demand curve for economics textbooks shifts to the left, then the value of the marginal product of labor for economics textbook authors will
A) rise.
B) fall.
C) remain unchanged.
D) rise or fall; either is possible.
F) B) and C)
Correct Answer

verified
Correct Answer
verified
True/False
An increase in the output price will increase the firm's demand for labor, all else equal.
B) False
Correct Answer

verified
Correct Answer
verified
Multiple Choice
Table 18-7  -Refer to Table 18-7. What is the value for the cell labeled FF?
A) 30
B) 40
C) 100
D) 400
F) All of the above
Correct Answer

verified
Correct Answer
verified
Multiple Choice
Figure 18-2
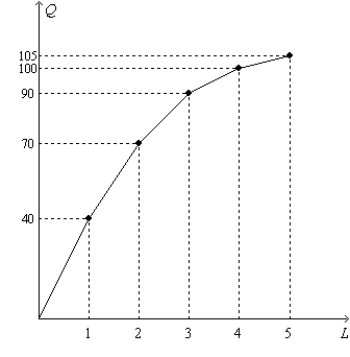
The figure below shows the production function for a particular firm.  -Refer to Figure 18-2. The marginal product of the third worker is
A) 20 units.
B) 30 units.
C) 40 units.
D) 70 units.
F) B) and C)
Correct Answer

verified
Correct Answer
verified
Multiple Choice
Which of the following is not an example of a factor of production?
A) labor
B) interest
C) land
D) capital
F) A) and C)
Correct Answer

verified
Correct Answer
verified
True/False
The opportunity cost of leisure is impossible to measure because we cannot measure leisure time in dollars.
B) False
Correct Answer

verified
Correct Answer
verified
Multiple Choice
Suppose that the market for labor is initially in equilibrium. If the firm employs labor-saving technology, the equilibrium wage
A) and the equilibrium quantity of labor will rise.
B) and the equilibrium quantity of labor will fall.
C) will rise, and the equilibrium quantity of labor will fall.
D) will fall, and the equilibrium quantity of labor will rise.
F) B) and C)
Correct Answer

verified
Correct Answer
verified
True/False
The value of the marginal product of capital can be calculated as the marginal product of capital multiplied by the cost of the capital input.
B) False
Correct Answer

verified
Correct Answer
verified
Multiple Choice
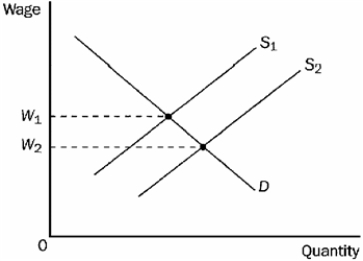
Figure 18-7  -Refer to Figure 18-7. Assume W1 = $15 and W2 = $12, and the market is always in equilibrium. A shift of the labor supply curve from S1 to S2 would
A) increase the value of the marginal product of labor by $3.
B) decrease the value of the marginal product of labor by $3.
C) decrease the value of the marginal product of labor by more than $3.
D) not change the value of the marginal product of labor.
F) None of the above
Correct Answer

verified
Correct Answer
verified
Multiple Choice
For a profit-maximizing competitive firm, the value of marginal product curve is
A) always rising.
B) falling only when marginal product is rising.
C) the labor supply curve.
D) the labor demand curve.
F) A) and C)
Correct Answer

verified
Correct Answer
verified
Multiple Choice
Table 18-9
The following table shows the production function for a particular business. The numbers represent the various labor and output combinations the firm may choose for its output on a daily basis.  -Refer to Table 18-9. Suppose this firm charges a price of $5 per unit of output and pays workers a wage equal to $160 per day. What is the value of the marginal product of labor for the second worker?
A) $300
B) $650
C) $9,600
D) $20,800
F) A) and B)
Correct Answer

verified
Correct Answer
verified
Multiple Choice
Figure 18-8
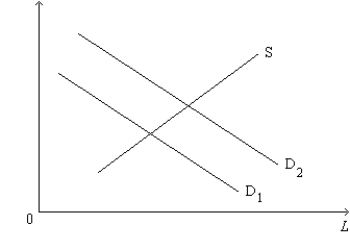
This figure below shows the labor market for automobile workers. The curve labeled S is the labor supply curve, and the curves labeled D1 and D2 are the labor demand curves. On the horizontal axis, L represents the quantity of labor in the market.  -Refer to Figure 18-8. Which of the following events would most likely explain the shift of the labor-demand curve from D1 to D2?
A) The price of automobiles decreased.
B) A large number of immigrants entered the automobile-worker market.
C) A technological advance increased the marginal product of automobile workers.
D) All of the above are correct.
F) All of the above
Correct Answer

verified
Correct Answer
verified
Multiple Choice
When economists refer to a firm's capital, they are describing the
A) markets for final goods and services.
B) stock of equipment and buildings used in production.
C) amount of bank financing used by the firm.
D) amount of financing provided by the equity markets.
F) A) and C)
Correct Answer

verified
Correct Answer
verified
Multiple Choice
Consider the labor market for computer programmers. Because of the dot.com boom in the late 1990s, a lot of workers went to school to learn how to write computer code for one of thousands of new dot.com companies. However, when these computer programming students graduated the dot.com bust took place. The dot.com bust decreased the value of the marginal product of computer programmers. Holding all else equal what effect did these two circumstances have on the equilibrium quantity in the labor market for computer programmers?
A) The equilibrium quantity of labor increased.
B) The equilibrium quantity of labor decreased.
C) The equilibrium quantity of labor did not change.
D) It is not possible to determine what happens to the equilibrium quantity of labor.
F) All of the above
Correct Answer

verified
Correct Answer
verified
Multiple Choice
As a result of a labeling mistake at the chemical factory, a farmer accidentally sprays weedkiller rather than fertilizer on half her land. As a result, she loses half of her productive farmland. If the property of diminishing returns applies to all factors of production, she should expect to see the marginal productivity of her remaining land
A) increase.
B) remain unchanged.
C) decrease but remain positive.
D) decrease and become negative.
F) B) and C)
Correct Answer

verified
Correct Answer
verified
True/False
Let L represent the quantity of labor, and let Q represent the quantity of output. Suppose a certain production function includes the points (L = 7, Q = 27), (L = 8, Q = 35), and (L = 9, Q = 45). Based on these three points, this production function exhibits diminishing marginal product.
B) False
Correct Answer

verified
Correct Answer
verified
Multiple Choice
Figure 18-1
On the graph, L represents the quantity of labor and Q represents the quantity of output per week.  -Refer to Figure 18-1. Suppose the firm sells its output for $20 per unit, and it pays each of its workers $1,250 per week. The firm maximizes profit by hiring
A) 3 workers.
B) 4 workers.
C) 5 workers.
D) 6 workers.
F) B) and C)
Correct Answer

verified
Correct Answer
verified
Showing 521 - 540 of 592
Related Exams