A) a decrease in income
B) an increase in the price of a substitute
C) an increase in the price of a complement
D) None of the above is correct.
F) A) and B)
Correct Answer

verified
Correct Answer
verified
Multiple Choice
A movement downward and to the right along a demand curve is called a(n)
A) increase in demand.
B) decrease in demand.
C) decrease in quantity demanded.
D) increase in quantity demanded.
F) None of the above
Correct Answer

verified
Correct Answer
verified
Multiple Choice
A likely example of complementary goods for most people would be
A) butter and margarine.
B) lawnmowers and automobiles.
C) chips and salsa.
D) cola and lemonade.
F) A) and B)
Correct Answer

verified
Correct Answer
verified
Multiple Choice
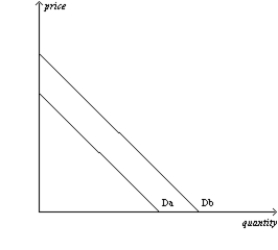
Figure 4-7  -Refer to Figure 4-7. If the demand curve for Good X shifts from Db to Da, then
A) firms would be willing to supply more of Good X than before at each possible price.
B) people are willing to buy less of Good X than before at each possible price.
C) people's incomes must have increased.
D) the price of Good X has increased.
F) All of the above
Correct Answer

verified
Correct Answer
verified
Multiple Choice
If the number of sellers in a market increases, then the
A) demand in that market will increase.
B) supply in that market will increase.
C) supply in that market will decrease.
D) demand in that market will decrease.
F) A) and D)
Correct Answer

verified
Correct Answer
verified
True/False
An increase in the price of a substitute good will shift the demand curve for a good to the right.
B) False
Correct Answer

verified
Correct Answer
verified
Multiple Choice
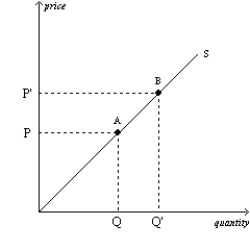
Figure 4-11  -Refer to Figure 4-11. The movement from point A to point B on the graph is called
A) a decrease in supply.
B) an increase in supply.
C) an increase in the quantity supplied.
D) a decrease in the quantity supplied.
F) None of the above
Correct Answer

verified
Correct Answer
verified
Multiple Choice
In a market economy, supply and demand determine
A) both the quantity of each good produced and the price at which it is sold.
B) the quantity of each good produced but not the price at which it is sold.
C) the price at which each good is sold but not the quantity of each good produced.
D) neither the quantity of each good produced nor the price at which it is sold.
F) A) and C)
Correct Answer

verified
Correct Answer
verified
Multiple Choice
You lose your job and, as a result, you buy more frozen pizzas. For you, frozen pizza are a(n)
A) luxury good.
B) inferior good.
C) normal good.
D) complementary good.
F) C) and D)
Correct Answer

verified
Correct Answer
verified
True/False
A yard sale is an example of a market.
B) False
Correct Answer

verified
Correct Answer
verified
Multiple Choice
Which of these statements does not apply to market economies?
A) Prices prevent decentralized decision making from degenerating into chaos.
B) Prices coordinate the actions of millions of people with varying abilities and desires.
C) Prices ensure that anyone who wants a product can get it.
D) Prices ensure that what needs to get done does in fact get done.
F) A) and B)
Correct Answer

verified
Correct Answer
verified
Multiple Choice
If the demand for a product increases, then we would expect equilibrium price
A) to increase and equilibrium quantity to decrease.
B) to decrease and equilibrium quantity to increase.
C) and equilibrium quantity both to increase.
D) and equilibrium quantity both to decrease.
F) B) and D)
Correct Answer

verified
Correct Answer
verified
True/False
Baseballs and baseball bats are substitute goods.
B) False
Correct Answer

verified
Correct Answer
verified
Multiple Choice
Once the demand curve for a product or service is drawn, it
A) remains stable over time.
B) can shift either rightward or leftward.
C) is possible to move along the curve, but the curve will not shift.
D) tends to become steeper over time.
F) All of the above
Correct Answer

verified
Correct Answer
verified
Multiple Choice
Wheat is the main input in the production of flour. If the price of wheat decreases, then we would expect the
A) demand for flour to increase.
B) demand for flour to decrease.
C) supply of flour to increase.
D) supply of flour to decrease.
F) All of the above
Correct Answer

verified
Correct Answer
verified
Multiple Choice
What would happen to the equilibrium price and quantity of lattés if coffee shops began using a machine that reduced the amount of labor necessary to produce steamed milk, which is used to make lattés, and scientists discovered that coffee prevents heart attacks?
A) Both the equilibrium price and quantity would increase.
B) Both the equilibrium price and quantity would decrease.
C) The equilibrium price would increase, and the effect on equilibrium quantity would be ambiguous.
D) The equilibrium quantity would increase, and the effect on equilibrium price would be ambiguous.
F) None of the above
Correct Answer

verified
Correct Answer
verified
Multiple Choice
Suppose you like to make, from scratch, pies filled with banana cream and vanilla pudding. You notice that the price of bananas has increased. As a result, your demand for vanilla pudding would
A) decrease.
B) increase.
C) be unaffected.
D) There is insufficient information given to answer the question.
F) A) and B)
Correct Answer

verified
Correct Answer
verified
Multiple Choice
Which of the following is an example of a market?
A) a gas station
B) a garage sale
C) a barber shop
D) All of the above are examples of markets.
F) A) and D)
Correct Answer

verified
Correct Answer
verified
Multiple Choice
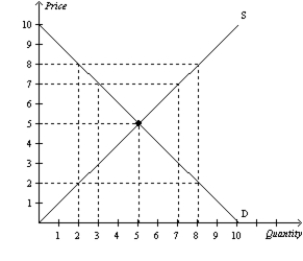
Figure 4-17  -Refer to Figure 4-17. At a price of
A) $2, there is a surplus of 6 units.
B) $5, there is a surplus of 25 units.
C) $5, there is a shortage of $25.
D) $7, there is a surplus of 4 units.
F) C) and D)
Correct Answer

verified
Correct Answer
verified
Short Answer
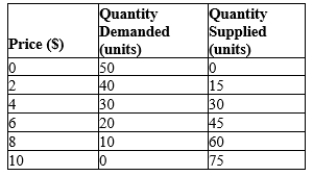
Table 4-16
The following table shows the supply and demand schedules in a market.  -Refer to Table 4-16. What is the equilibrium quantity in this market?
Correct Answer

verified
Correct Answer
verified
Showing 621 - 640 of 693
Related Exams