B) False
Correct Answer

verified
Correct Answer
verified
Multiple Choice
We can say that the allocation of resources is efficient if
A) producer surplus is maximized.
B) consumer surplus is maximized.
C) total surplus is maximized.
D) sellers' costs are minimized.
F) A) and C)
Correct Answer

verified
Correct Answer
verified
Multiple Choice
Table 7-9 -Refer to Table 7-9. The equilibrium market price for 10 piano lessons is $400. What is the total producer surplus in the market?
A) $0
B) $300
C) $400
D) $700
F) B) and D)
Correct Answer

verified
Correct Answer
verified
Multiple Choice
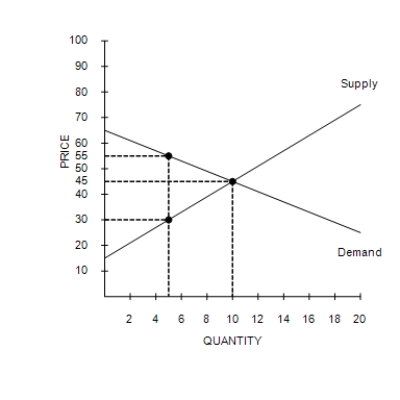
Figure 7-7
 -Refer to Figure 7-7. If the government imposes a price ceiling of $55 in this market, then total surplus will be
A) $187.50.
B) $125.00.
C) $250.00.
D) $266.67.
F) A) and B)
Correct Answer

verified
Correct Answer
verified
True/False
Economists generally believe that, although there may be advantages to society from ticket-scalping, the costs to society of this activity outweigh the benefits.
B) False
Correct Answer

verified
Correct Answer
verified
True/False
The cost of production plus producer surplus is the price a seller is paid.
B) False
Correct Answer

verified
Correct Answer
verified
True/False
The current policy on kidney donation effectively sets a price ceiling of zero.
B) False
Correct Answer

verified
Correct Answer
verified
True/False
Even though participants in the economy are motivated by self-interest, the "invisible hand" of the marketplace guides this self-interest into promoting general economic well-being.
B) False
Correct Answer

verified
Correct Answer
verified
True/False
Producer surplus measures the benefit to sellers from receiving a price above their costs.
B) False
Correct Answer

verified
Correct Answer
verified
Multiple Choice
Tomato sauce and spaghetti noodles are complementary goods. A decrease in the price of tomatoes will
A) increase consumer surplus in the market for tomato sauce and decrease producer surplus in the market for spaghetti noodles.
B) increase consumer surplus in the market for tomato sauce and increase producer surplus in the market for spaghetti noodles.
C) decrease consumer surplus in the market for tomato sauce and increase producer surplus in the market for spaghetti noodles.
D) decrease consumer surplus in the market for tomato sauce and decrease producer surplus in the market for spaghetti noodles.
F) A) and B)
Correct Answer

verified
Correct Answer
verified
Multiple Choice
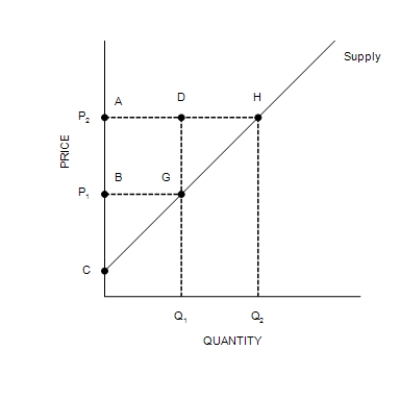
Figure 7-4
 -Refer to Figure 7-4. Which area represents producer surplus when the price is P1?
A) BCG
B) ACH
C) ABGD
D) DGH
F) A) and D)
Correct Answer

verified
Correct Answer
verified
True/False
Joel has a 1966 Mustang, which he sells to Susie, an avid car collector. Susie is pleased since she paid $8,000 for the car but would have been willing to pay $11,000 for the car. Susie's consumer surplus is $2,000.
B) False
Correct Answer

verified
Correct Answer
verified
True/False
For any given quantity, the price on a demand curve represents the marginal buyer's willingness to pay.
B) False
Correct Answer

verified
Correct Answer
verified
Multiple Choice
Table 7-11 -Refer to Table 7-12. Both the demand curve and the supply curve are straight lines. At equilibrium, producer surplus is
A) $24.
B) $32.
C) $48.
D) $64.
F) C) and D)
Correct Answer

verified
Correct Answer
verified
Multiple Choice
Table 7-3 -Refer to Table 7-3. If you have 3 (essentially) identical tickets that you sell to the group in an auction, assuming that each person can only buy one ticket, which of the following is closest to the selling price for each ticket?
A) $11
B) $21
C) $16
D) $35
F) None of the above
Correct Answer

verified
Correct Answer
verified
True/False
If Darby values a soccer ball at $50, and she pays $40 for it, her consumer surplus is $90.
B) False
Correct Answer

verified
Correct Answer
verified
Multiple Choice
Jim builds furniture for a living. Jim's out-of-pocket expenses (for wood, paint, etc.) plus the value that he places on his own time amount to his
A) producer surplus.
B) producer deficit.
C) cost of building furniture.
D) profit.
F) A) and B)
Correct Answer

verified
Correct Answer
verified
Multiple Choice
Dawn's bridal boutique is having a sale on evening dresses. The increase in consumer surplus comes from the benefit of the lower prices to
A) only existing customers who now get lower prices on the gowns they were already planning to purchase.
B) only new customers who enter the market because of the lower prices.
C) both existing customers who now get lower prices on the gowns they were already planning to purchase and new customers who enter the market because of the lower prices.
D) Consumer surplus does not increase; it decreases.
F) None of the above
Correct Answer

verified
Correct Answer
verified
Multiple Choice
Table 7-10 -Refer to Table 7-10. You want to hire a professional photographer to take pictures of your family. The table shows the costs of the four potential sellers in the local photography market. Which of the following graphs represents the market supply curve?
A) ![]()
B) ![]()
C) ![]()
D) ![]()
F) A) and B)
Correct Answer

verified
Correct Answer
verified
True/False
Efficiency is related to the size of the economic pie, whereas equality is related to how the pie gets sliced and distributed.
B) False
Correct Answer

verified
Correct Answer
verified
Showing 21 - 40 of 218
Related Exams