A) left,making output rise.
B) left,making output fall.
C) right,making output rise.
D) right,making output fall.
F) A) and C)
Correct Answer

verified
Correct Answer
verified
Multiple Choice
A favorable supply shock
A) raises unemployment and the inflation rate.
B) raises unemployment and reduces the inflation rate.
C) reduces unemployment and raises the inflation rate.
D) reduces unemployment and the inflation rate.
F) None of the above
Correct Answer

verified
Correct Answer
verified
Multiple Choice
In 1980,the U.S.economy had an inflation rate of
A) about 1 percent and an unemployment rate of about 7 percent.
B) less than 4 percent and an unemployment rate of less than 6 percent.
C) less than 7 percent and an unemployment rate of about 9 percent.
D) more than 9 percent and an unemployment rate of about 7 percent.
F) A) and C)
Correct Answer

verified
Correct Answer
verified
Multiple Choice
An adverse supply shock will shift short-run aggregate supply
A) right,making prices rise.
B) left,making prices rise.
C) right,making prices fall.
D) left,making prices fall.
F) All of the above
Correct Answer

verified
Correct Answer
verified
Multiple Choice
Which of the following is an example of an adverse supply shock?
A) a decrease in the money supply
B) a tax cut
C) a worldwide drought
D) decreased government spending
F) A) and C)
Correct Answer

verified
Correct Answer
verified
Multiple Choice
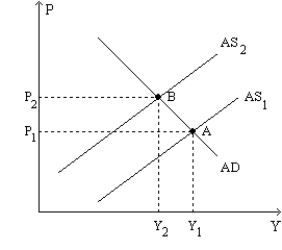
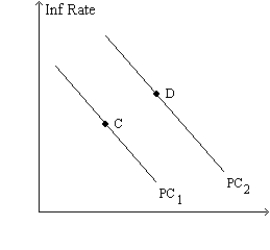
Figure 35-9.The left-hand graph shows a short-run aggregate-supply (SRAS) curve and two aggregate-demand (AD) curves.On the right-hand diagram,"Inf Rate" means "Inflation Rate." 
 -Refer to Figure 35-9.The shift of the aggregate-supply curve from AS1 to AS2
A) results in a more favorable trade-off between inflation and unemployment.
B) results in a more favorable trade-off between inflation and the growth rate of real GDP.
C) represents an adverse shock to aggregate supply.
D) represents a favorable shock to aggregate supply.
F) B) and C)
Correct Answer

verified
Correct Answer
verified
Multiple Choice
Suppose OPEC is unable to come to an agreement regarding oil production and as a result the price of oil drops.Which of the following would you expect to occur as a result of this favorable supply shock?
A) The short-run Phillips curve will shift to the right and the unemployment rate will increase.
B) The short-run Phillips curve will shift to the right and the unemployment rate will decrease.
C) The short-run Phillips curve will shift to the left and the unemployment rate will increase.
D) The short-run Phillips curve will shift to the left and the unemployment rate will decrease.
F) C) and D)
Correct Answer

verified
Correct Answer
verified
Multiple Choice
After an oil price shock,which of the following would move unemployment back towards its natural rate?
A) the Fed sells bonds
B) the government raises taxes
C) the government increases expenditures
D) All of the above are correct.
F) A) and C)
Correct Answer

verified
Correct Answer
verified
Multiple Choice
A favorable supply shock will cause the price level
A) and output to rise.
B) and output to fall.
C) to rise and output to fall.
D) to fall and output to rise.
F) A) and D)
Correct Answer

verified
Correct Answer
verified
Multiple Choice
In which case,if any,will inflation remain higher after a temporary adverse supply shock?
A) both when the central bank maintains a higher money supply growth rate and when the central bank does nothing
B) only if the central bank does nothing
C) only if the central bank maintains a higher money supply growth rate
D) None of the above is correct.Whether the central bank maintains a higher money supply growth rate or not,the inflation rate will return to its original level.
F) A) and D)
Correct Answer

verified
Correct Answer
verified
Multiple Choice
If there is a temporary adverse supply shock,then the short-run Phillips curve shifts to the
A) right.It remains to the right regardless of monetary policy.
B) right.It remains to the right if the central bank pursues expansionary monetary policy.
C) left.It remains to the left regardless of monetary policy.
D) left.It remains to the left if the central bank pursues expansionary monetary policy.
F) A) and C)
Correct Answer

verified
Correct Answer
verified
Multiple Choice
If policymakers accommodate an adverse supply shock,then in the short run the unemployment rate
A) and the inflation rate rise.
B) and the inflation rate fall.
C) rises and the inflation rate falls.
D) falls and the inflation rate rises.
F) B) and D)
Correct Answer

verified
Correct Answer
verified
Multiple Choice
Figure 35-9.The left-hand graph shows a short-run aggregate-supply (SRAS) curve and two aggregate-demand (AD) curves.On the right-hand diagram,"Inf Rate" means "Inflation Rate." 
 -Refer to Figure 35-9.A significant increase in the world price of oil could explain
A) the shift of the aggregate-supply curve from AS1 to AS2,but it could not explain the shift of the Phillips curve from PC1 to PC2.
B) the shift of the Phillips curve from PC1 to PC2,but it could not explain the shift of the aggregate-supply curve from AS1 to AS2.
C) both the shift of the aggregate-supply curve from AS1 to AS2 and the shift of the Phillips curve from PC1 to PC2.
D) neither the shift of the aggregate-supply curve from AS1 to AS2 nor the shift of the Phillips curve from PC1 to PC2.
F) A) and D)
Correct Answer

verified
Correct Answer
verified
Multiple Choice
An increase in the price of oil shifts the
A) short-run Phillips curve right and the unemployment rate rises.
B) short-run Phillips curve right and the unemployment rate falls.
C) short-run Phillips curve left and the unemployment rate rises.
D) short-run Phillips curve left and the unemployment rate falls.
F) A) and C)
Correct Answer

verified
Correct Answer
verified
Multiple Choice
If the Fed wants to reverse the effects of an adverse supply shock on unemployment,it should
A) increase the money supply growth rate which raises the inflation rate.
B) increase the money supply growth rate which reduces the inflation rate.
C) decrease the money supply growth rate which raises the inflation rate.
D) decrease the money supply growth rate which reduces the inflation rate.
F) All of the above
Correct Answer

verified
Correct Answer
verified
Multiple Choice
Which of the following results in higher inflation and higher unemployment in the short run?
A) a more expansionary monetary policy
B) a more contractionary monetary policy
C) a decrease in the minimum wage
D) an adverse supply shock such as an increase in the price of oil
F) B) and D)
Correct Answer

verified
Correct Answer
verified
Multiple Choice
Figure 35-9.The left-hand graph shows a short-run aggregate-supply (SRAS) curve and two aggregate-demand (AD) curves.On the right-hand diagram,"Inf Rate" means "Inflation Rate." 
 -Refer to Figure 35-9.Subsequent to the shift of the Phillips curve from PC1 to PC2,the curve will soon shift back to PC1 if people perceive the
A) increase in the inflation rate as a temporary aberration.
B) economic boom as a temporary aberration.
C) increase in the inflation rate as a sign of a new era of higher inflation.
D) economic boom as a sign of a new era of higher economic growth.
F) C) and D)
Correct Answer

verified
Correct Answer
verified
Multiple Choice
In 1980,the combination of inflation and unemployment the U.S.was experiencing
A) resulted from a leftward shift of the short-run Phillips curve.
B) was consistent with feasible inflation-unemployment combinations provided by the Phillips curve of the 1960s.
C) followed two supply shocks that were triggered by the Organization of Petroleum Exporting Countries.
D) All of the above are correct.
F) A) and B)
Correct Answer

verified
Correct Answer
verified
Multiple Choice
An event that directly affects firms' costs of production and thus the prices they charge is called
A) a Phillips contraction.
B) an inflationary spiral.
C) a demand shock.
D) a supply shock.
F) A) and D)
Correct Answer

verified
Correct Answer
verified
Multiple Choice
Which of the following shifts aggregate supply to the right?
A) a decline in the price of imported natural resources
B) a technological advance
C) an older labor force that leaves jobs less frequently
D) All of the above are correct.
F) All of the above
Correct Answer

verified
Correct Answer
verified
Showing 41 - 60 of 60
Related Exams