B) False
Correct Answer

verified
Correct Answer
verified
Multiple Choice
A relatively flat demand curve indicates that
A) quantity demanded will adjust only slightly to a price change.
B) quantity demanded will adjust significantly to a price change.
C) quantity demanded will not adjust to a price change.
D) the change in quantity demanded will exactly equal a change in price.
F) B) and C)
Correct Answer

verified
Correct Answer
verified
Multiple Choice
Which of the following statements is are) correct?
A) Relative to some other scientists, economists find it more difficult to conduct experiments.
B) Theory and observation are important in economics as well as in other sciences.
C) To obtain data, economists often rely upon the natural experiments offered by history.
D) All of the above are correct.
F) All of the above
Correct Answer

verified
Correct Answer
verified
Multiple Choice
Economists view positive statements as
A) affirmative, justifying existing economic policy.
B) optimistic, putting the best possible interpretation on things.
C) descriptive, making a claim about how the world is.
D) prescriptive, making a claim about how the world ought to be.
F) B) and D)
Correct Answer

verified
Correct Answer
verified
Multiple Choice
Normative conclusions
A) come from positive analysis alone.
B) are based on ignorance of positive analysis.
C) involve value judgments.
D) reflect the economist's role as scientist.
F) B) and D)
Correct Answer

verified
Correct Answer
verified
Essay
Figure 2-22 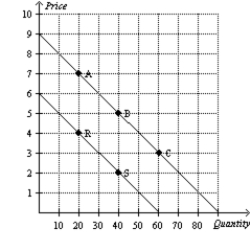 -Refer to Figure 2-22. Is a move from point A to point R considered a shift of the curve or a movement along the curve?
Correct Answer

verified
Correct Answer
verified
Multiple Choice
Economists regard events from the past as
A) irrelevant, since history is unlikely to repeat itself.
B) of limited interest, since those events seldom provide any useful economic data.
C) interesting but not particularly valuable, since those events cannot be used to evaluate present-day economic theories.
D) interesting and valuable, since those events are capable of helping us to understand the past, the present, and the future.
F) A) and D)
Correct Answer

verified
Correct Answer
verified
Multiple Choice
Figure 2-4  -Refer to Figure 2-4. This economy has the ability to produce at which points) ?
A) Q, R, T, U
B) R, T, U
C) R, U
D) T
F) A) and C)
Correct Answer

verified
Correct Answer
verified
Multiple Choice
Figure 2-2 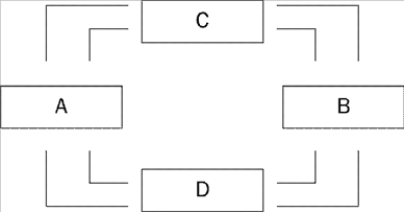 -Refer to Figure 2-2. If households are buyers in the markets represented by Box C of this circular-flow diagram, then
A) Box C must represent the markets for the factors of production.
B) Box D must represent the markets for goods and services.
C) firms are sellers in the markets represented by Box C.
D) All of the above are correct.
F) B) and C)
Correct Answer

verified
Correct Answer
verified
Multiple Choice
Figure 2-1 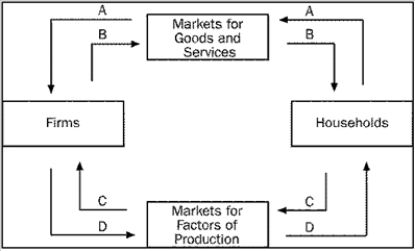 -Refer to Figure 2-1. Harvey receives his first paycheck for working as an ice cream vendor. To which of the arrows does this transaction directly contribute?
A) B only
B) A and B
C) C only
D) C and D
F) A) and B)
Correct Answer

verified
Correct Answer
verified
Multiple Choice
Figure 2-1  -Refer to Figure 2-1. Which arrow represents the flow of income payments?
A) A
B) B
C) C
D) D
F) All of the above
Correct Answer

verified
Correct Answer
verified
True/False
If a line passes through the points 20,5) and 10,10), then the slope of the line is 1/2.
B) False
Correct Answer

verified
Correct Answer
verified
Multiple Choice
Figure 2-16 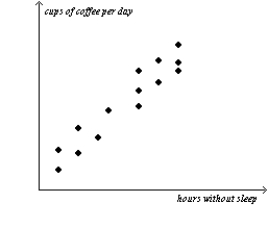 -Refer to Figure 2-16. Cups of coffee per day and the hours that someone can go without sleep appear to have
A) a positive correlation.
B) a negative correlation.
C) a random correlation.
D) no correlation.
F) All of the above
Correct Answer

verified
Correct Answer
verified
Multiple Choice
Figure 2-4  -Refer to Figure 2-4. Unemployment could cause this economy to produce at which points) ?
A) Q, S
B) Q, S, T
C) R, U
D) T
F) A) and B)
Correct Answer

verified
Correct Answer
verified
Multiple Choice
Positive statements are
A) prescriptive.
B) claims about how the world should be.
C) claims about how the world is.
D) made by economists speaking as policy advisers.
F) B) and C)
Correct Answer

verified
Correct Answer
verified
True/False
Two variables that have a negative correlation move in opposite directions.
B) False
Correct Answer

verified
Correct Answer
verified
True/False
A production possibilities frontier will be bowed outward if some of the economy's resources are better suited to producing one good than another.
B) False
Correct Answer

verified
Correct Answer
verified
Multiple Choice
Figure 2-19
In the following graph the x-axis shows the number of times a commuter rail train stops at a station per hour and the y-axis shows the number of commuter rail passengers per hour.
Commuter Rail Passengers by Frequency of Service 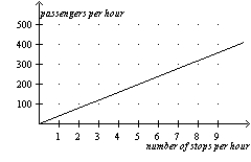 -Refer to Figure 2-19. A policymaker observes this graph and concludes that increasing the frequency of commuter rail service is a certain way to get more commuters to choose the commuter rail instead of driving their own cars. You warn the policymaker about making a reverse causality mistake with which of the following statements?
A) Higher gas prices are causing more people to choose the commuter rail over driving.
B) The service frequency was increased in response to an increase in the number of passengers per hour.
C) There is a positive relationship between frequency of stops and number of passengers.
D) None of the above is correct.
F) All of the above
Correct Answer

verified
Correct Answer
verified
Multiple Choice
Figure 2-4  -Refer to Figure 2-4. Inefficient production is represented by which points) ?
A) Q, S
B) Q, S, T
C) R, U
D) T
F) A) and B)
Correct Answer

verified
Correct Answer
verified
Multiple Choice
Which of the following is not correct?
A) The slope of a line will be a small positive number for a fairly flat upward-sloping line.
B) The slope of a line will be a large positive number for a steep upward-sloping line.
C) The slope of a line will be a negative number for a downward-sloping line.
D) The slope of a line will be infinite for a horizontal line.
F) C) and D)
Correct Answer

verified
Correct Answer
verified
Showing 381 - 400 of 620
Related Exams