A) When input prices increase, sellers produce less of the good.
B) When production technology improves, sellers produce less of the good.
C) When the price of a good decreases, sellers produce less of the good.
D) When sellers' supplies of a good increase, the price of the good increases.
F) A) and C)
Correct Answer

verified
Correct Answer
verified
True/False
An increase in the price of a substitute good will shift the demand curve for a good to the right.
B) False
Correct Answer

verified
Correct Answer
verified
Multiple Choice
You have been asked by your economics professor to graph the market for lumber and then to analyze the change that would occur in equilibrium price as a result of recent forest fires in the west. Your first step would be to
A) decide which direction to shift the curve.
B) decide whether the fires affected demand or supply.
C) graph the shift to see the effect on equilibrium.
D) None of the above is correct.
F) A) and C)
Correct Answer

verified
Correct Answer
verified
Multiple Choice
Each of the following is a determinant of demand except
A) tastes.
B) production technology.
C) expectations.
D) the prices of related goods.
F) B) and D)
Correct Answer

verified
Correct Answer
verified
True/False
A shortage is the same as an excess demand.
B) False
Correct Answer

verified
Correct Answer
verified
True/False
A decrease in the price of a product and an increase in the number of buyers in the market affect the demand curve in the same general way.
B) False
Correct Answer

verified
Correct Answer
verified
Multiple Choice
Table 4-9
 -Refer to Table 4-9. Which combination would produce a decrease in equilibrium price and an indeterminate change in equilibrium quantity?
A) A
B) B
C) C
D) D
F) B) and C)
Correct Answer

verified
Correct Answer
verified
Multiple Choice
Figure 4-16 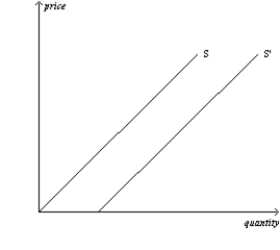 -Refer to Figure 4-16. The shift from S to S' is called an)
A) decrease in supply.
B) decrease in quantity supplied.
C) increase in supply.
D) increase in quantity supplied.
F) None of the above
Correct Answer

verified
Correct Answer
verified
Multiple Choice
Which of the following is an example of a less-than-highly-organized market?
A) the market for U.S. Treasury bonds
B) the market for corn
C) the market for soybeans
D) the market for ice cream
F) C) and D)
Correct Answer

verified
Correct Answer
verified
Multiple Choice
The following table contains a monthly demand schedule for large, single-topping, carry-out pizzas.  If the law of demand applies to these pizzas, then A could be
A) 0.
B) 15.
C) 25.
D) 30.
F) A) and C)
Correct Answer

verified
Correct Answer
verified
Multiple Choice
Which of the following is not a determinant of demand?
A) the price of a resource that is used to produce the good
B) the price of a complementary good
C) the price of the good next month
D) the price of a substitute good
F) A) and C)
Correct Answer

verified
Correct Answer
verified
Multiple Choice
Figure 4-26 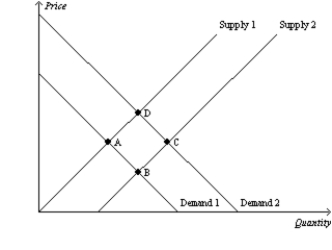 -Refer to Figure 4-26. Which of the following movements would illustrate the effect in the market for doctor's visits of an increase in the number of medical students graduating from medical school and successfully completing their residency programs?
A) Point A to Point B
B) Point C to Point B
C) Point C to Point D
D) Point A to Point D
F) None of the above
Correct Answer

verified
Correct Answer
verified
Multiple Choice
Figure 4-25
The graph below pertains to the supply of paper to colleges and universities. 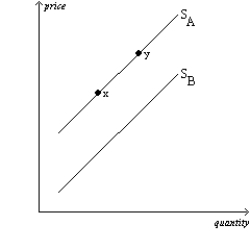 -Refer to Figure 4-25. All else equal, an increase in the use of laptop computers for note-taking would cause a move from
A) x to y.
B) y to x.
C) SA to SB.
D) SB to SA.
F) A) and C)
Correct Answer

verified
Correct Answer
verified
Multiple Choice
Figure 4-4
Yasmine Mercedes
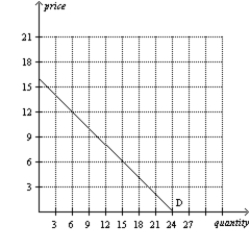
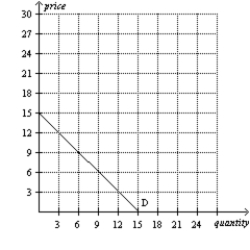 -Refer to Figure 4-4. Suppose Yasmine and Mercedes are the only two consumers in the market. When the market price falls from $12 to $6, the quantity demanded increases by
A) 6 units.
B) 9 units.
C) 12 units.
D) 15 units.
F) A) and D)
Correct Answer

verified
Correct Answer
verified
Multiple Choice
Table 4-2
 -Refer to Table 4-2. Suppose Abby, Brandi, Carrie, and DeeDee are the only four buyers in the market. If the price is $8, then the market quantity demanded is
A) 4 units.
B) 6 units.
C) 24 units.
D) 32 units.
F) All of the above
Correct Answer

verified
Correct Answer
verified
True/False
An increase in the price of cotton will increase the equilibrium price and decrease the equilibrium quantity in the market for cotton t-shirts.
B) False
Correct Answer

verified
Correct Answer
verified
Multiple Choice
Figure 4-5 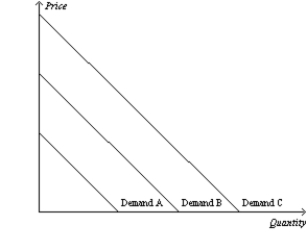 -Refer to Figure 4-5. Which of the following would cause the demand curve to shift from Demand B to Demand A in the market for oranges in the United States?
A) a freeze in Florida
B) a technological advance that allows oranges to ripen faster
C) a decrease in the price of apples
D) an announcement by the FDA that oranges prevent heart disease
F) C) and D)
Correct Answer

verified
Correct Answer
verified
Multiple Choice
The demand for a good or service is determined by
A) those who buy the good or service.
B) the government.
C) those who sell the good or service.
D) both those who buy and those who sell the good or service.
F) C) and D)
Correct Answer

verified
Correct Answer
verified
True/False
An increase in the price of ink will shift the supply curve for pens to the left.
B) False
Correct Answer

verified
Correct Answer
verified
Multiple Choice
An increase in the price of a good will
A) increase supply.
B) decrease supply.
C) increase quantity supplied.
D) decrease quantity supplied.
F) A) and B)
Correct Answer

verified
Correct Answer
verified
Showing 581 - 600 of 700
Related Exams