A) goods and services, households and firms are both sellers.
B) goods and services, households are sellers and firms are buyers.
C) the factors of production, households are sellers and firms are buyers.
D) the factors of production, households and firms are both buyers.
F) B) and C)
Correct Answer

verified
Correct Answer
verified
Multiple Choice
The two loops in the circular-flow diagram represent
A) the flow of goods and the flow of services.
B) the flow of dollars and the flow of financial assets.
C) the flow of inputs into production processes and the flow of outputs from production processes.
D) the flows of inputs and outputs and the flow of dollars.
F) B) and C)
Correct Answer

verified
Correct Answer
verified
Multiple Choice
Which of the following statements is correct about the roles of economists?
A) Economists are best viewed as policy advisers.
B) Economists are best viewed as scientists.
C) In trying to explain the world, economists are policy advisers; in trying to improve the world, they are scientists.
D) In trying to explain the world, economists are scientists; in trying to improve the world, they are policy advisers.
F) B) and C)
Correct Answer

verified
Correct Answer
verified
Multiple Choice
Figure 2-9
Panel (a) Panel (b) 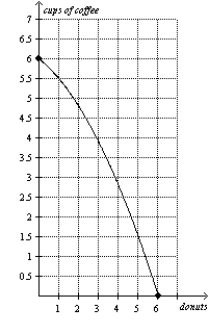
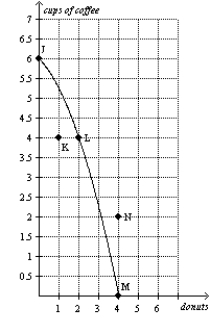 -Refer to Figure 2-9, Panel (a) . The opportunity cost of moving from point J to point L is
A) 2 donuts.
B) 2 donuts and 2 cups of coffee.
C) 2 cups of coffee.
D) 6 cups of coffee.
F) A) and C)
Correct Answer

verified
Correct Answer
verified
Multiple Choice
Figure 2-20
Relationship Between Years of Education and Annual Income 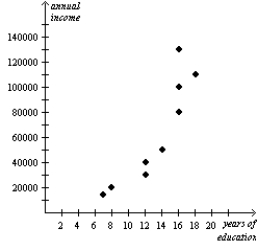 -Refer to Figure 2-20. The graph above is a
A) bar graph
B) scatterplot
C) pie chart
D) time series analysis
F) B) and C)
Correct Answer

verified
Correct Answer
verified
Multiple Choice
Economic models
A) are constructed to mirror reality as closely as possible, and in this respect economic models are no different from other scientific models.
B) are constructed to mirror reality as closely as possible, and in this respect economic models are very different from other scientific models.
C) are simplifications of reality, and in this respect economic models are no different from other scientific models.
D) are simplifications of reality, and in this respect economic models are very different from other scientific models.
F) A) and C)
Correct Answer

verified
Correct Answer
verified
Short Answer
Like biologists and physicists, economists use the dispassionate development and testing of how the world works known as the
Correct Answer

verified
Correct Answer
verified
True/False
An economic model can accurately explain how the economy is organized because it is designed to include, to the extent possible, all features of the real world.
B) False
Correct Answer

verified
Correct Answer
verified
Multiple Choice
Home is a country that produces two goods, pears and cellular phones. Last year, Home produced 450 bushels of pears and 1050 cellular phones. This year it produced 450 bushels of pears and 2000 cellular phones. Given no other information, which of the following events could explain this change?
A) Home experienced increased unemployment.
B) Home experienced a decline in pear-producing technology.
C) Home experienced an improvement in cellular phone-making technology.
D) Home experienced a reduction in resources.
F) None of the above
Correct Answer

verified
Correct Answer
verified
Multiple Choice
Figure 2-16 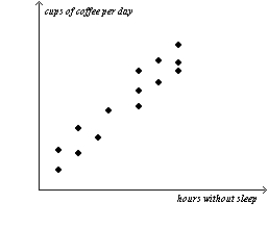 -Refer to Figure 2-16. The graph shown is known as a
A) time-series graph.
B) bar graph.
C) scatterplot.
D) pie chart.
F) A) and C)
Correct Answer

verified
Correct Answer
verified
Short Answer
Who would be more likely to study the effects of government spending on the unemployment rate, a macroeconomist or a microeconomist?
Correct Answer

verified
Correct Answer
verified
Multiple Choice
Figure 2-5 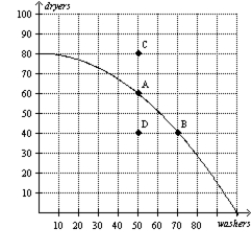 -Refer to Figure 2-5. The opportunity cost of this economy moving from point A to point B is
A) 20 dryers.
B) 20 washers.
C) 20 dryers and 20 washers.
D) 60 dryers.
F) A) and C)
Correct Answer

verified
Correct Answer
verified
Multiple Choice
Figure 2-6 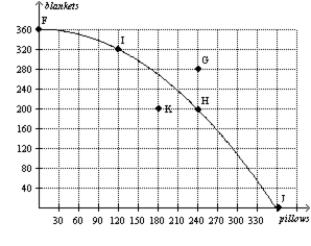 -Refer to Figure 2-6. The opportunity cost of this economy moving from point I to point H is
A) 120 pillows.
B) 120 blankets.
C) 120 blankets and 120 pillows.
D) 200 blankets.
F) None of the above
Correct Answer

verified
Correct Answer
verified
Multiple Choice
Indiadesh is a country that produces two goods, textiles and computers. Last year, Indiadesh produced 50,000 textiles and 1300 computers. This year it produced 45,000 textiles and 1100 computers. Given no further information, which of the following events could explain this change?
A) Indiadesh decreased unemployment.
B) Indiadesh experienced an improvement in textile-making technology.
C) Indiadesh experienced an improvement in computer-making technology.
D) Indiadesh experienced a reduction in resources.
F) None of the above
Correct Answer

verified
Correct Answer
verified
Multiple Choice
In the markets for factors of production in the circular-flow diagram,
A) households provide firms with labor, land, and capital.
B) households provide firms with savings for investment.
C) firms provide households with goods and services.
D) firms provide households with revenue.
F) B) and C)
Correct Answer

verified
Correct Answer
verified
Multiple Choice
The Council of Economic Advisers
A) was created in 1946.
B) advises the president of the United States on economic policy matters.
C) writes the annual Economic Report of the President.
D) All of the above are correct.
F) A) and C)
Correct Answer

verified
Correct Answer
verified
Multiple Choice
It is possible for an economy to increase its production of both goods if the economy
A) moves downward and to the right along its production possibilities frontier and the frontier is bowed outward.
B) moves upward and to the left along its production possibilities frontier and the frontier is bowed outward.
C) moves in either direction along its production possibilities frontier and the frontier is a straight line.
D) moves from a situation of inefficient production to a situation of efficient production.
F) B) and D)
Correct Answer

verified
Correct Answer
verified
Short Answer
Suppose a war in the Middle East interrupts the flow of crude oil and oil prices skyrocket around the world. For economists, this historical episode serves as a
Correct Answer

verified
Correct Answer
verified
True/False
If a major union goes on strike, then the country would be operating inside its production possibilities frontier.
B) False
Correct Answer

verified
Correct Answer
verified
Multiple Choice
Figure 2-21 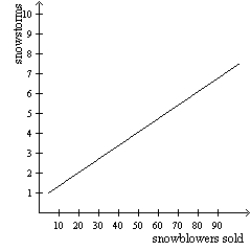 -Refer to Figure 2-21. According to the graph, snowstorms
A) and snowblowers sold are positively correlated.
B) and snowblowers sold are negatively correlated
C) and snowblowers sold are uncorrelated.
D) are caused by more snowblowers being sold.
F) C) and D)
Correct Answer

verified
Correct Answer
verified
Showing 481 - 500 of 617
Related Exams